Potential Annual Revenue
based on United States Market Size
Assumptions
0
75,000 unpowered low-head dams in the USA
0
2250 are able to be utilized for hydroelectric purposes with this technology
0
Typically 5 generating units per site
0
kW
Average annualized output per turbine unit
$.0 0
/kWH
Recent grid average sale price
Potential
63958
kWH
Annual power output per site = 350 x 24 x 365 x 5 = 15,330,000 kWH
$ 5611
Annual value of power produced per site = 15,330,000 x.077 = $1,180,410
$ 91458
Annual revenue value of all sites = $1,180,410 x 2250 = $2,660,000,000
Simplified Payback Analysis Cost Model
Revenue
Using very conservative estimates, a simplified financial model, average annual revenue, and an average of 5-Units per site installation…
- Based on estimated annual revenue per generating unit of $236,800 at 350 kW average annual output and $.077 per kWH pricing
- A single 5-Unit site operation would yield annual revenue of approximately $1,180,410.
Cost
Total present value of one-time installation costs and ongoing operating costs
- Site and Unit Installation Costs
- Costs include generating unit field installation, electrical interconnection equipment and construction, permitting, start-up costs, and the present value of ongoing O&M
- Grid interconnection equipment and installation costs are estimated to be $2,000,000 per site plus $1,000,000 per unit, or $7,000,000 for a 5-unit site.
Unit Production Costs
- The cost to produce and deliver each generating unit is estimated at $1,000,000 or $5.0 million for a 5-Unit site
- The total present value cost to install a five-unit site is estimated at $7 million
Simple EBITDA Payback
- Dividing costs by revenue produces a simple payback of 5.9 years
- Payback is highly sensitive to turbine efficiency, site development cost, generating unit cost, and site power production potential
- Research enabling effective design, fabrication, and construction of the generating unit will be a significant factor enabling financial success
Comparison of Competing Technologies
Design Features

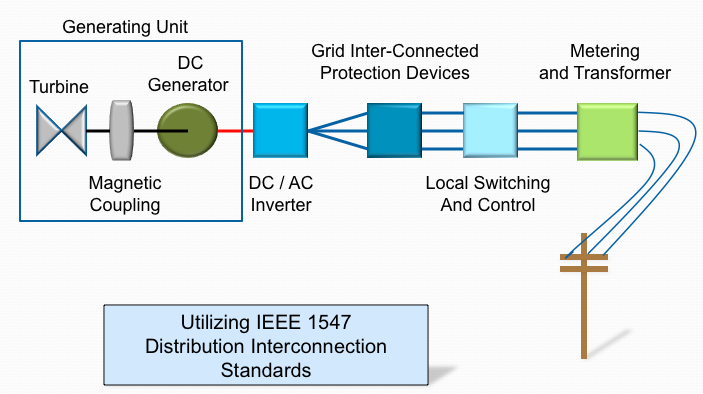
- Electrically, the units will be designed to produce 30kW to 350kW of power at 480 volt Direct Current (DC). The present design utilizes a commercially available inverter to convert the DC voltage generated to 3-phase Alternating Current (AC).
- The AC current is then stepped-up to the appropriate Distribution Line voltage (typically 12-13kV) using a commonly available transformer
- All electrical interconnecting components between the device and the Utility’s Distribution system will follow IEEE Standard 1547.
- This standard was issued in 2003 and is well established and in common use at this time.
- The interconnection components are identical to those used for wind and solar installations and are commercially available from multiple vendors serving the industry.
- System protection and control devices, communication protocols, and metering standards are also well-established and in common practice throughout the US.

